


Poll Pollution
Citing "the Polls" to Justify Any Position is Just Lazy Journalism and Advocacy

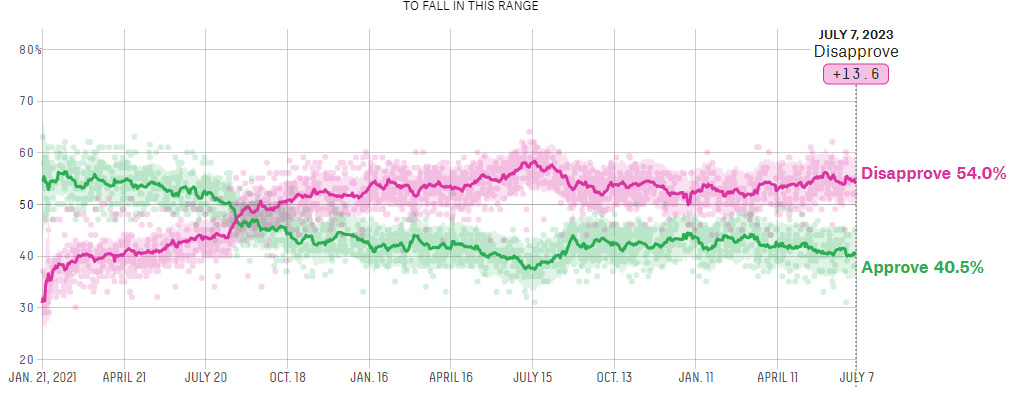
FiveThirtyEight.com’s Presidential Approval Tracker, 7/9/2023
I’m not a particular fan of panel shows, but I get their appeal on news channels. They suck up time, it gives an opportunity for each side to present their case briefly and the networks showcase the pundits they have on contract. Frankly, I think news networks rely a little too much on them and they have way too many pundits under contract, but on certain occasssions, such as after a debate, town hall or election night, they are kind of necessary to have around.
Which brings me to polls. Nothing on television news irritates me more than when someone (its usually a pundit but could just as easily be a journalist) says “The polls say…”. It’s just a verbal crutch to make it seem people support that side of whatever you are going to say next; it might not even be true. More often than not, the polls do not say what the invoker of the phrase says they do, and more importantly, polls are not indicative of what voters will be in the near and distant future.
Polls are just snapshots of opinions at a particular point in time and are retrospective in nature (looking backwards) instead of prospective. Of course, any variation from a previous poll is supposed to be evidence of some level of momentum one way or another, but as Nate Silver pointed out1 it could just be the margin of error and resultant “noise.” More often, polls ebb and flow based on the varying press coverage at a particular instance in time; nobody may be paying attention to issue #1 right now but if you put wall to wall coverage on it, the interest (and fear) can spike.2
Demonstrating the Point
Below are a series of Gallup polls from this point (the five polls stretch from May to mid-July) in a previous Presidential primary race. Most recent polls are at the top. I’ve hidden the names for the time being:
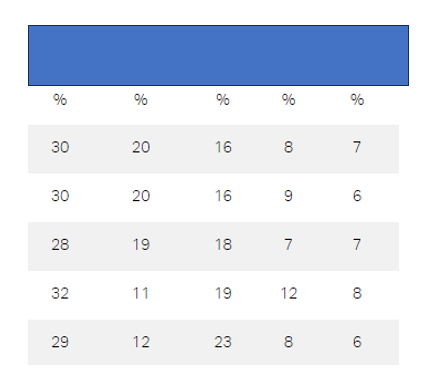
What do these polls tell you? Seriously, anything? Did it tell you who ultimately won? Does it indicate the race will be particularly close? I can tell you that at the time, the press was lauding candidate one’s likelihood of winning the nomination, there was a groundswell growing for candidate number 2 (who had not yet announced yet but was about to) and the conventional wisdom was that candidate 3s campaign was imploding before our eyes and dead on arrival. Would candidates 4 or 5 ever be taken as a serious candidate?
Now look at who each of those candidates were:

The polls were from the 2008 GOP primary race. And every possible reason not to listen to polls can be found in the above:
First off, and most importantly, IT’S WAY TOO EARLY TO DRAW ANY CONCLUSIONS. Candidates are just getting into the race, fundraising, flying around the country. There may have been a debate or two. Not everyone has gotten in yet. The only press they’ve likely had is there campaign announcement and their previous stature before they got into the race. Voters haven’t made up their minds.
Second, elections are not a national popular vote as so many polls imply. They are instead fifty separate races in fifty separate states, and they go in a predetermined order. In 2008, if you remember, Giuliani had the highest national approval and appeared to be the outright leader throughout 2007. However, his strategy was to 1) avoid Iowa, since he was not a cultural conservative 2) avoid New Hampshire, which was where McCain always did well and 3) focus on Florida where there were a lot of former NY retirees. The result? Losing two early states badly doomed his campaign and the mountains of negative press coming out from each killed any chance of him winning the nomination.
You may look at Fred Thompson and be like “Wow, he’s skyrocketing!” In reality, this was the result of a lot of positive press encouraging him to get INTO the race. Once he got into the race and took part in a couple debates, voters looked at him as the candidate he was; lackluster, unpolished and quite dull.
McCain was the known commodity. What he was talking about in the summer of 2007 was a rehash of what he said in 2000 (before 9/11!) running on the “Straight Talk Express.” People had heard it all before and we were living in different times. He seemed more like a has-been at this point than a frontrunner. He was eight years older, sounding less vibrant (sound familiar?) and sparked little interest as voters flirted with alternatives. He would turn things around in Nov/Dec when he started focusing on Veterans (something he could relate to and demonstrate his empathy on), and with two surging wars and more returning home with serious injuries and PTSD, the message resonated. As voters’ first choices began to flail, they rallied around the old reliable candidate (again, sound familiar?)
Mitt Romney, who was a relative newcomer to national politics, wasn’t polling well because few knew him at the time and his campaign was largely just getting off the ground. He would go onto make a good showing in Iowa and eventually end up doing well throughout the primary season, catapaulting him to the nomination in 2012.
NONE of that is evidenced in the polls from summer 2007. Voters aren’t paying attention yet. They’re enjoying their summers, flirting with a cattle call of candidates, considering options, whining about the way things are and praising their ideal of what they think the way things ought to be. The polls are entirely reflections of the reputations all the candidates have built up to at this point. They are not indicative of where things will be once people start voting.
Fun with Statistics
Pop quiz: Using a 95% Confidence/5% Margin of Error, how many people need to change their opinions for a percentage to drop from 50% approval to 45% approval? Give up? A mere 19. Nineteen random people who may not follow news closely, may not care about who is in office or what is going on or just flip a coin one way or another can change the outcome of whether there was a statistically significant drop in “the polls” or not.
This is one of the reasons polls aren’t as reliable as many think. On any given day, pollsters can call a host of random people and not connect with at least 19 people, or have 19 people hang up on them, or have 19 people just not complete the poll with any seriousness. All of these results impact how “random” the calls are and the eventual results. This is why during the early 2000s to 2010s, a major issue was whether the polls included cell phones or only landlines; if you had a cell phone you were more likely to vote Democrat (younger, tech saavy) and if you had only landlines you would be more likely Republican (older, traditional). You can cite wide ranges of polls demonstrating this nuance.
Other results can vary based on the kind of screens pollsters use to qualify their results. “Likely Voters,” “Registered Voters,” “Registered [insert party affiliation here],” and “Independents” or “Swing voters” are all different voter screens that impact the results. How each of these are defined matters.3
And if you haven’t noticed that I intentionally used a 5% margin of error above in my examples instead of a 3% margin of error which is more accurate and more of a standard, then you’ve fallen for another way that pollsters hedge numbers. The difference between a 95% confidence/5% Margin of Error (385 respondents) and a 95% confidence 3% Margin of error (1,066 respondents) is quite notable.
You may also notice how I refer to “95% confidence”; this is indicative of how replicable the result is. Think of a target. The bullseye represents the margin of error in relation to dead center of the target; it can have a radius 3 cms or 5 cms (the margin of error), the bigger the margin the bigger the bullseye, the easier to hit. The confidence level is the probability of how often repeating the poll results in hitting the bullseye. If the result is outside of that 95%, we typically refer to those as “outliers.” So another way you could hedge on the result is to lower the confidence level; instead of aiming for hitting the target 95% of the time, aim for 90%. The difference between a 95% confidence/3% margin of error (1066 respondents) and 90% confidence (752 respondents) is notable as well. The more respondents you have, the more accurate the result; however, what gets reported is not always the number of respondents, just the margin of error.
Any polls that don’t highlight 1) the number of respondents, 2) the confidence level and 3) the margin of error is likely hedging on the results of one or the other. Any poll that is ever cited, you should immediately hone in on those three numbers along with the particular voter screen used (and if possible, read how that screen was determined).
The Main Point
Citing polls and using those to demonstrate support is actually more “wagging the dog” than it is a reflection of people demonstating a sincere or genuine belief. The way news organizations overrely on polling data is just a condescending view of people that they are all lemmings and follow whatever is dangled in front of them, that they are all more interested in following the latest trend than making principled choices. In that sense, polls are just people in the crowd asking how much they love the emperor’s new clothes as opposed to making up their own minds that there’s just nothing there.
PurpleAmerica’s Recommended Stories
A few great books on polling and statistics that everyone should read if they get a chance.
First, there was the forementioned book by Nate Silver, “The Signal and the Noise.” This gets into the nuts and bolts of polling and what the numbers eventually mean.
One of my all time favorite college books that I had to read for my Political Science degree was “Lies, Damn Lies and Statistics.” Its a little dated now, but still worth your time.
https://www.amazon.com/Lies-Damn-Statistics-Manipulation-Opinion/dp/0393331490/ref=sr_1_1?crid=Q3RDBJSAZAKK&keywords=lies+damn+lies+and+statistics&qid=1689269969&s=books&sprefix=Lies+damn+lies+and+stati%2Cstripbooks%2C117&sr=1-1

And lastly, in the same vein as the above, is “How to Lie with Statistics.”
PurpleAmerica’s Obscure Fact of the Day
In the late 1800s, a statistician named Francis Galton was attending a livestock fair when he stumbled upon an intriguing phenomenon. The fair held a competition where attendees could guess the weight of an ox. Galton, being a curious scientist, collected the 787 guesses submitted by various individuals. To his surprise, he found that while individual guesses varied widely, the average of all the guesses was incredibly close to the actual weight of the ox.
This incident sparked Galton's interest in what he termed "the wisdom of crowds." He went on to conduct further experiments and developed the concept of statistical aggregation, suggesting that the collective judgment of a diverse group of people can often yield more accurate results than the judgment of an individual expert. This concept has since been utilized in polling and forecasting methodologies, highlighting the power of statistical averages and the value of diverse perspectives in decision-making processes.
PurpleAmerica’s Final Word on the Subject
As if to demonstrate my case of everyting mentioned above, Drew Savicki who pays particularly close attention to these things posts this:

As if ignoring one of the things that may be propping up DeSantis is Big Donor money and that Scott has shown some inroads in particular areas that money to help get his message out could have an outsize influence in getting his numbers up. As I said before, polls only show where things are now, not where they are going.
Like what you are seeing here at PurpleAmerica? Share and Comment. Let your friends and family know! Forward us topics you’d like us to discuss! It’s am open community here.
Footnotes and Fun Stuff
Nate Silver, “The Signal and the Noise”. Its a great book discussing the use of statistical sampling and highly recommended.
This is no joke. In February, 2020, less than 30% of Americans had heard of COVID-19, and initial polling largely showed unconcern or no opinion. A month later, following the annoucements that Tom Hanks had contracted COVID, the March Madness Basketball Tournament and other leagues were shutting down and the cluster of outbreaks had increased in the United States, the polling, concern and fear for it went through the roof.
For instance, is a “likely voter” someone who voted in the last presidential contest? If so, then you are not counting 18-22 year olds who skew Democratic. Is an “independent” someone who just isn’t a Democrat or Republican? They’re actually less likely to vote altogether. I have yet to hear a good definition of a “swing voter.” How each of these is defined is crucial in how reliable the results actually are.